
|
|
|
For more information see: Corné Kreemer's GSRM pages. THIS SITE NO LONGER MAINTAINED AND HERE FOR ARCHIVAL PURPOSES.Model VisualsSome GEM Global Strain Rate Model (GSRM) results are shown in the following visualizations. The model and results are by the Nevada Geodetic Laboratory, University of Nevada at Reno (UNR). The imagery, the KMZ file, and the Jules Verne Voyager visualizations were made by UNAVCO. The grid resolution is 0.1 degree by 0.1 degree, close to 10 km resolution. Model Data
Users can obtain text files with model results and input data by contacting Corné Kreemer (kreemer Google Earth
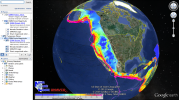
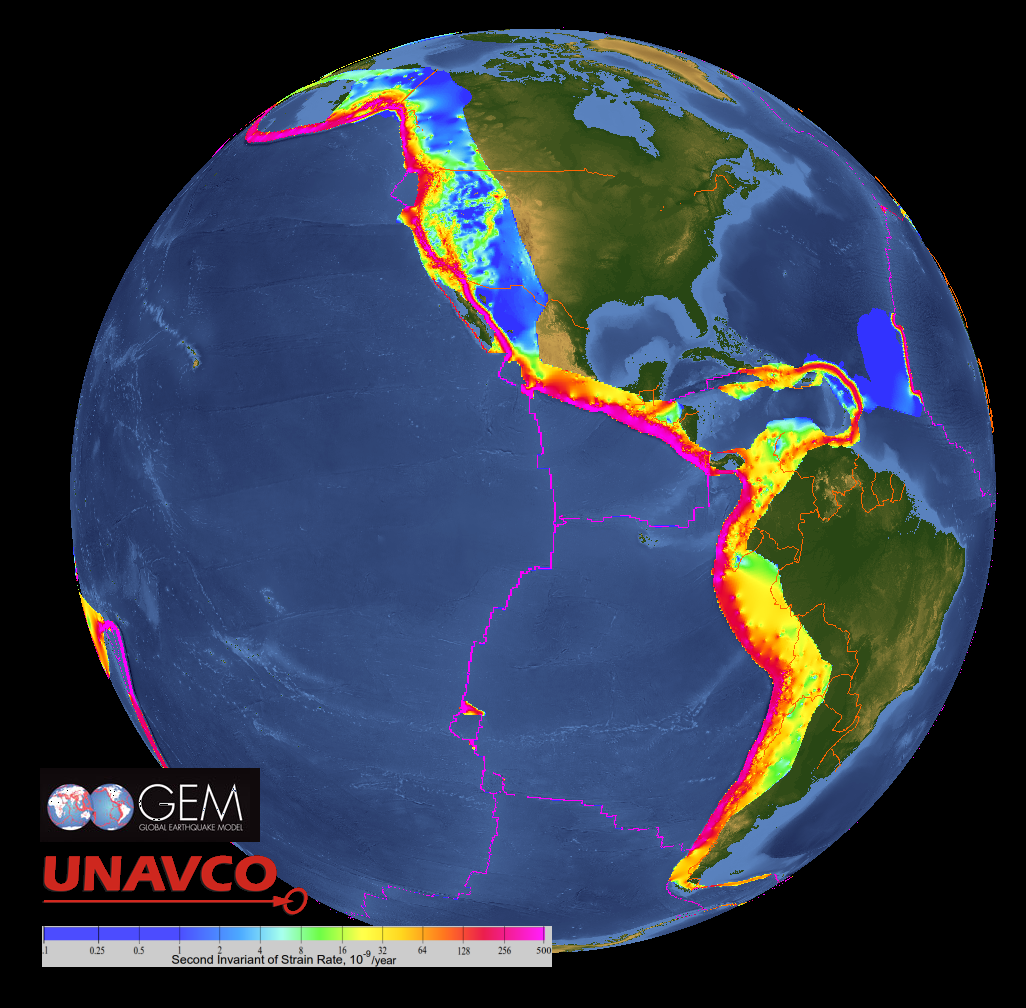
KMZ file of GEM strain rate magnitude imagery Colors show strain rate magnitude (second invariant of the strain rate tensor), in units of nanostrain (10-9) per year.. Jules Verne VoyagerThumbnail links to the strain rate magnitude, velocity vectors, and strain style, in the interactive Jules Verne Voyager:
The UNAVCO Jules Verne Voyager shows the GSRM's strain rate magnitude (second invariant of the strain rate tensor), and also velocity vectors, strain style, and other strain parameters. To see a legend for the colors, when you have the image you want, click on the 'pop-up' menu (pop-ups for jules.unavco.org must be allowed) and then click on 'anc' for "ancillary information". To learn how to use Voyager, see Jules Verne Voyager: Getting Started, the Tutorial, and the Advanced Help. Some Java plugins do not run the Jules Verne Voyager. GEM GSRM GPS Velocities Google Maps Tool
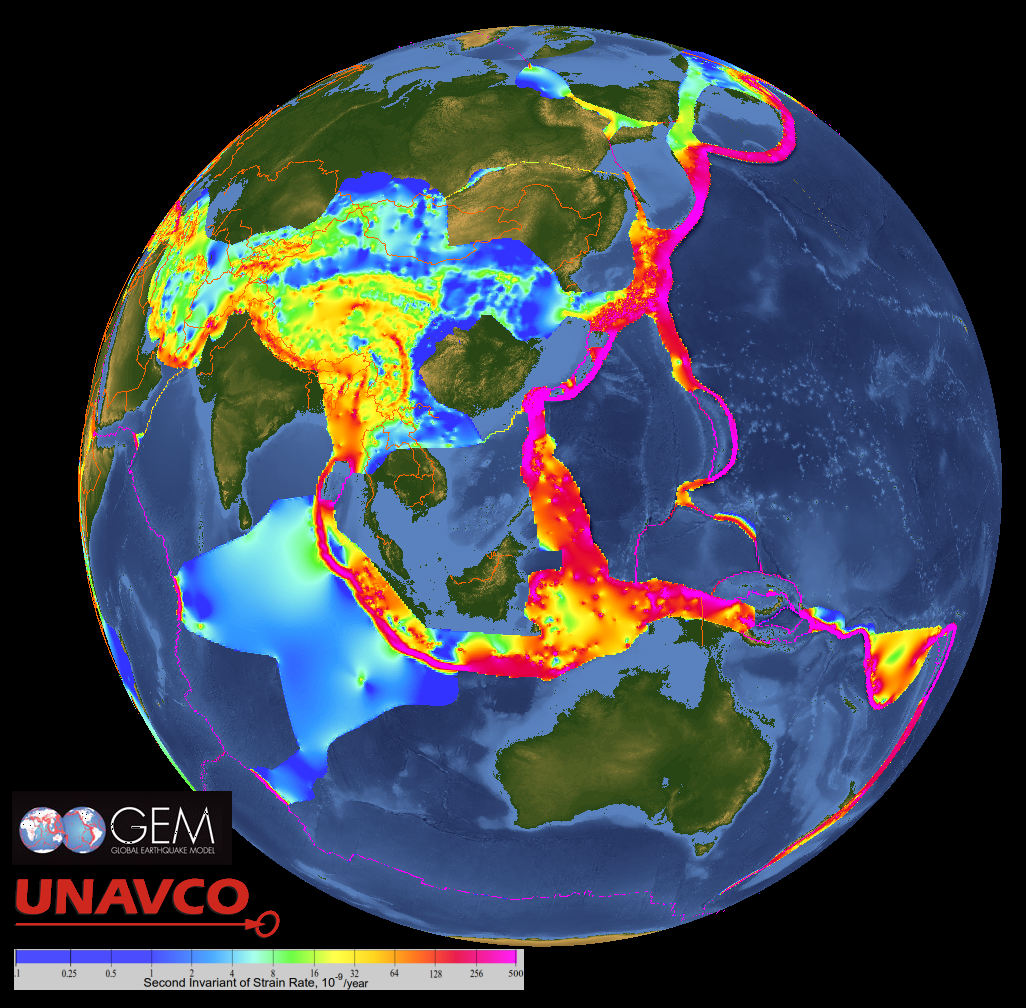
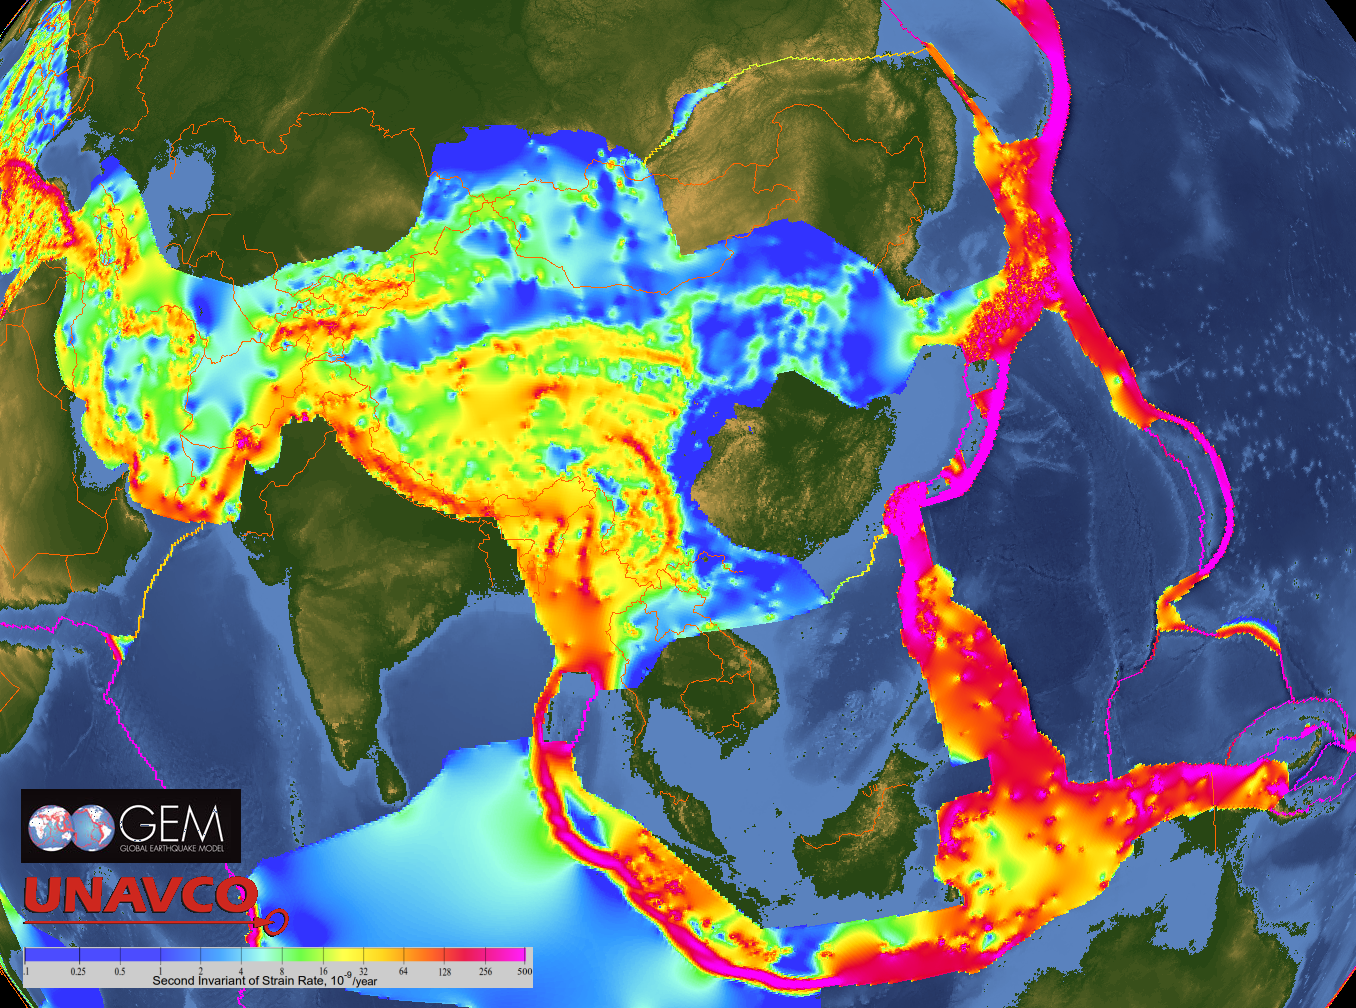
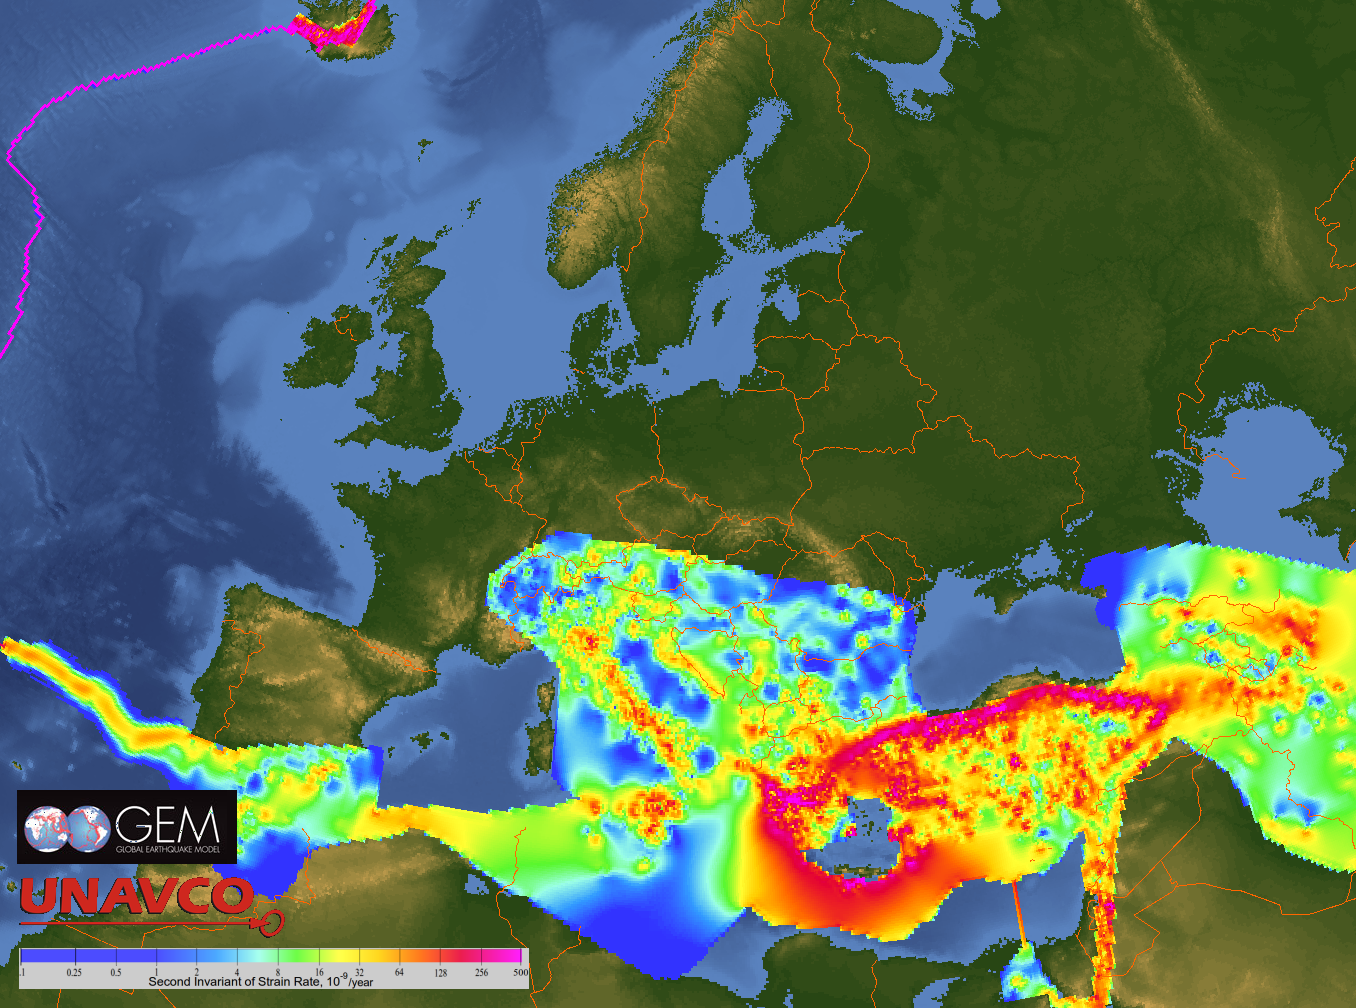
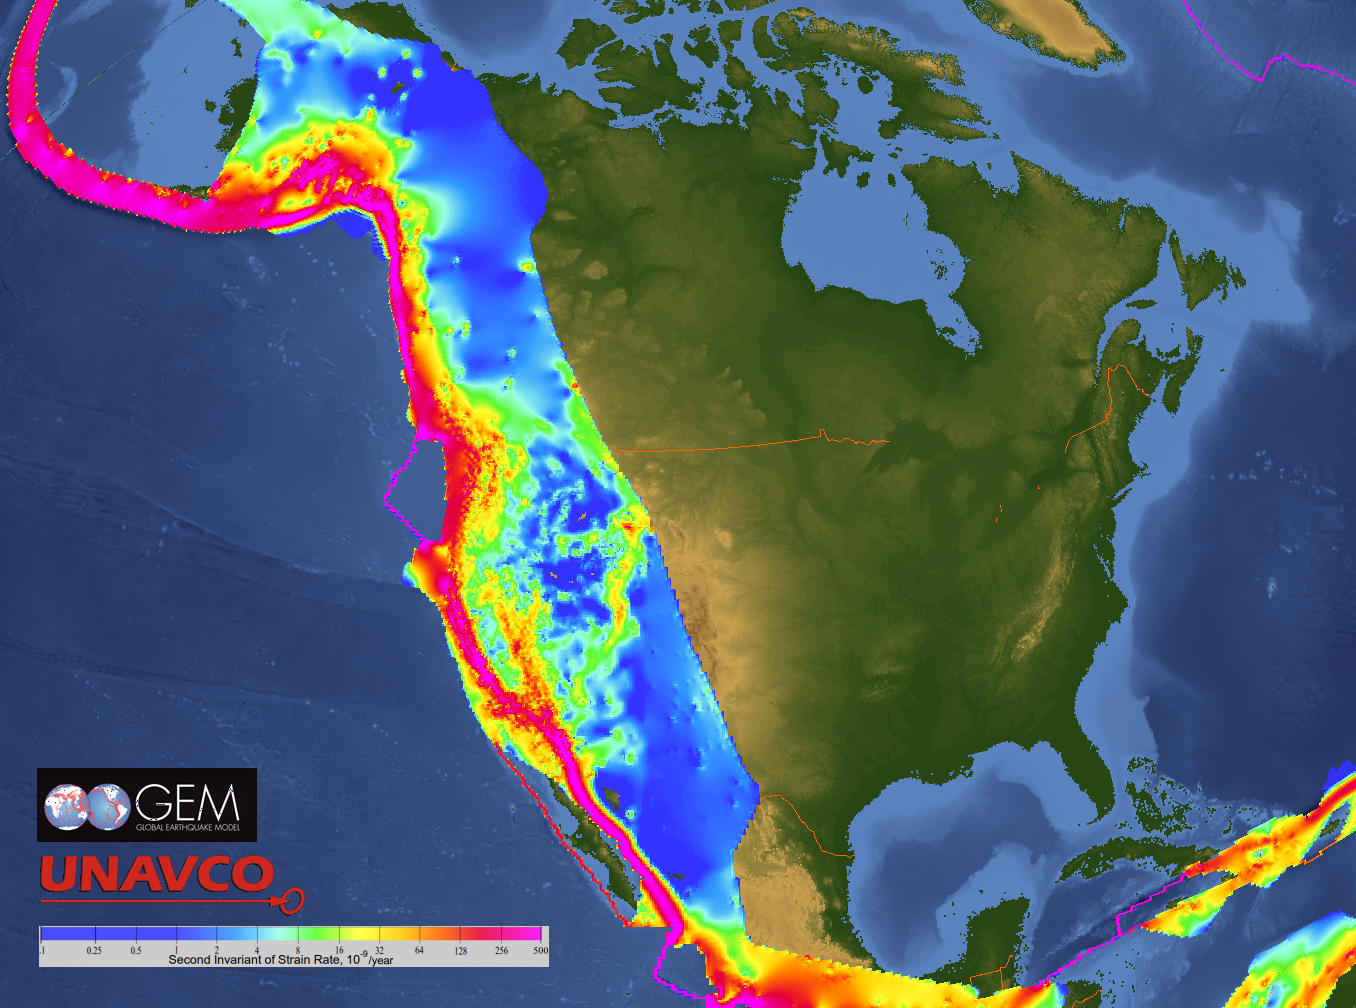
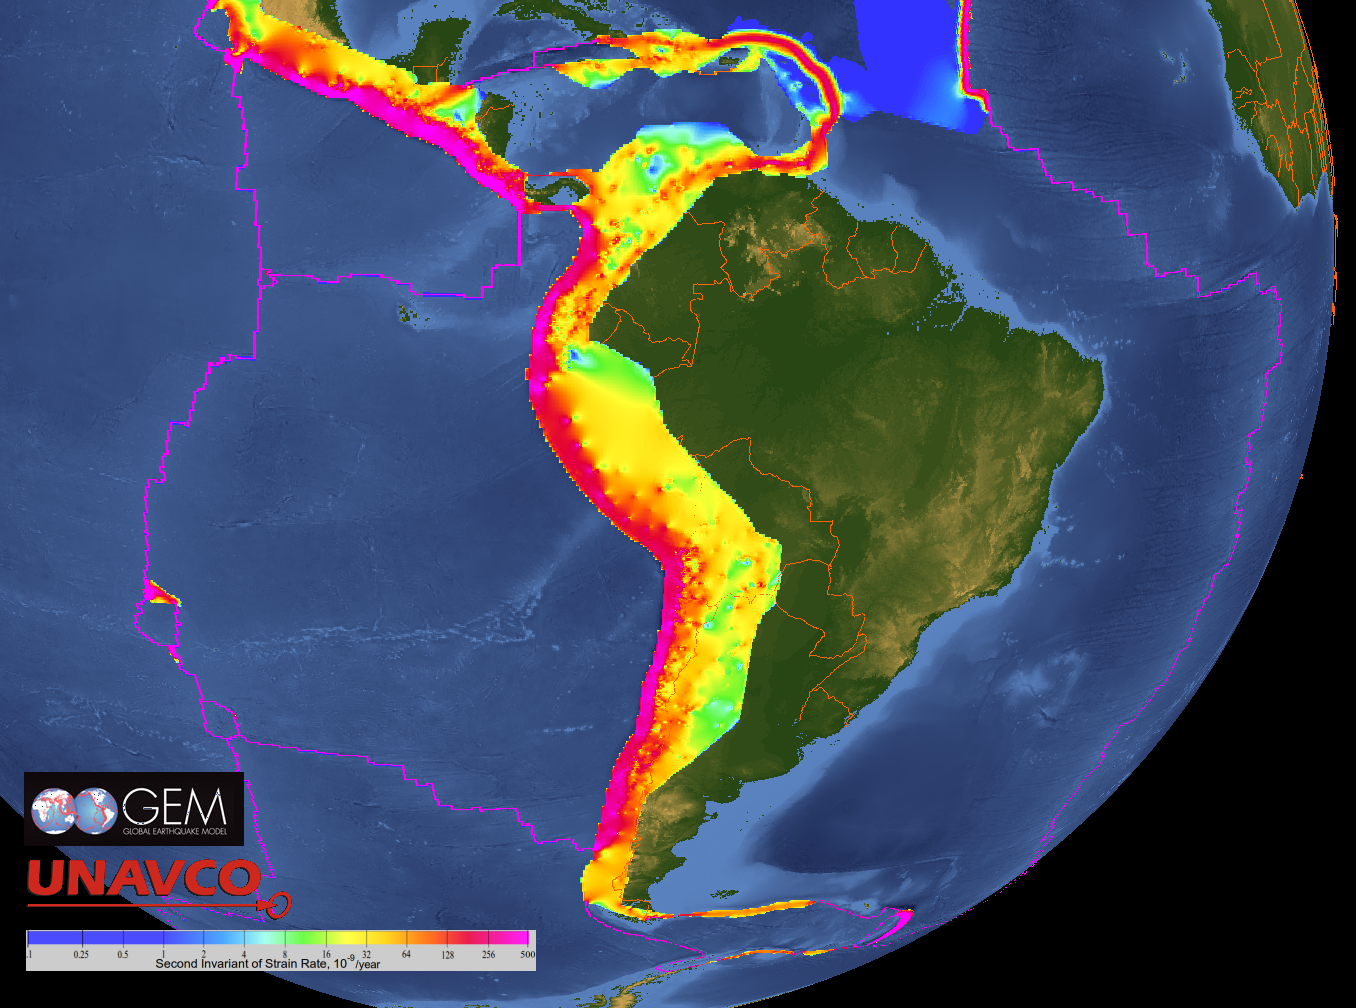
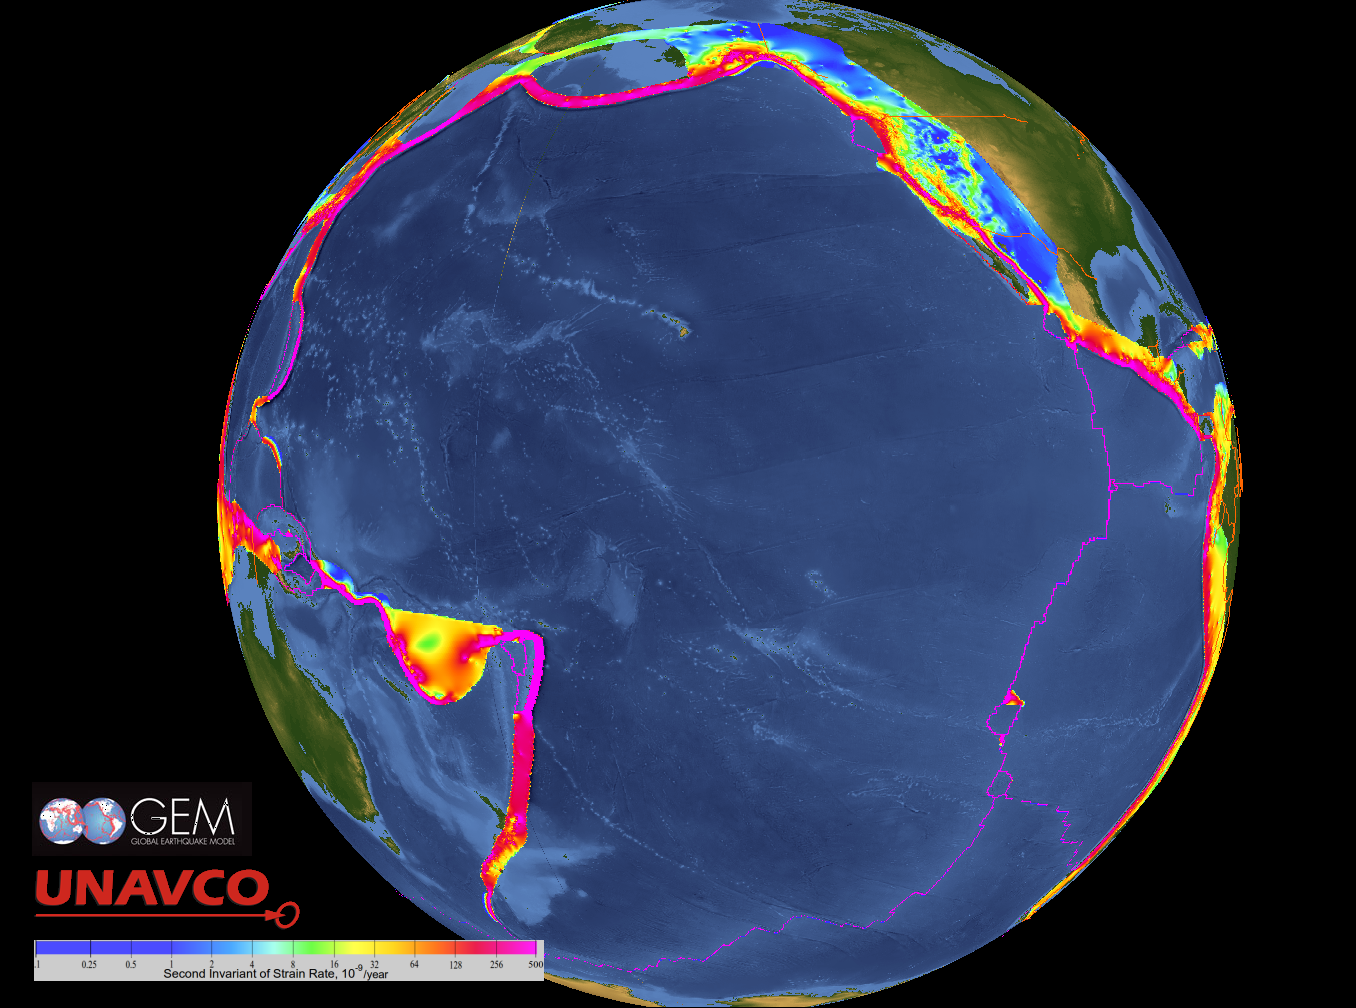
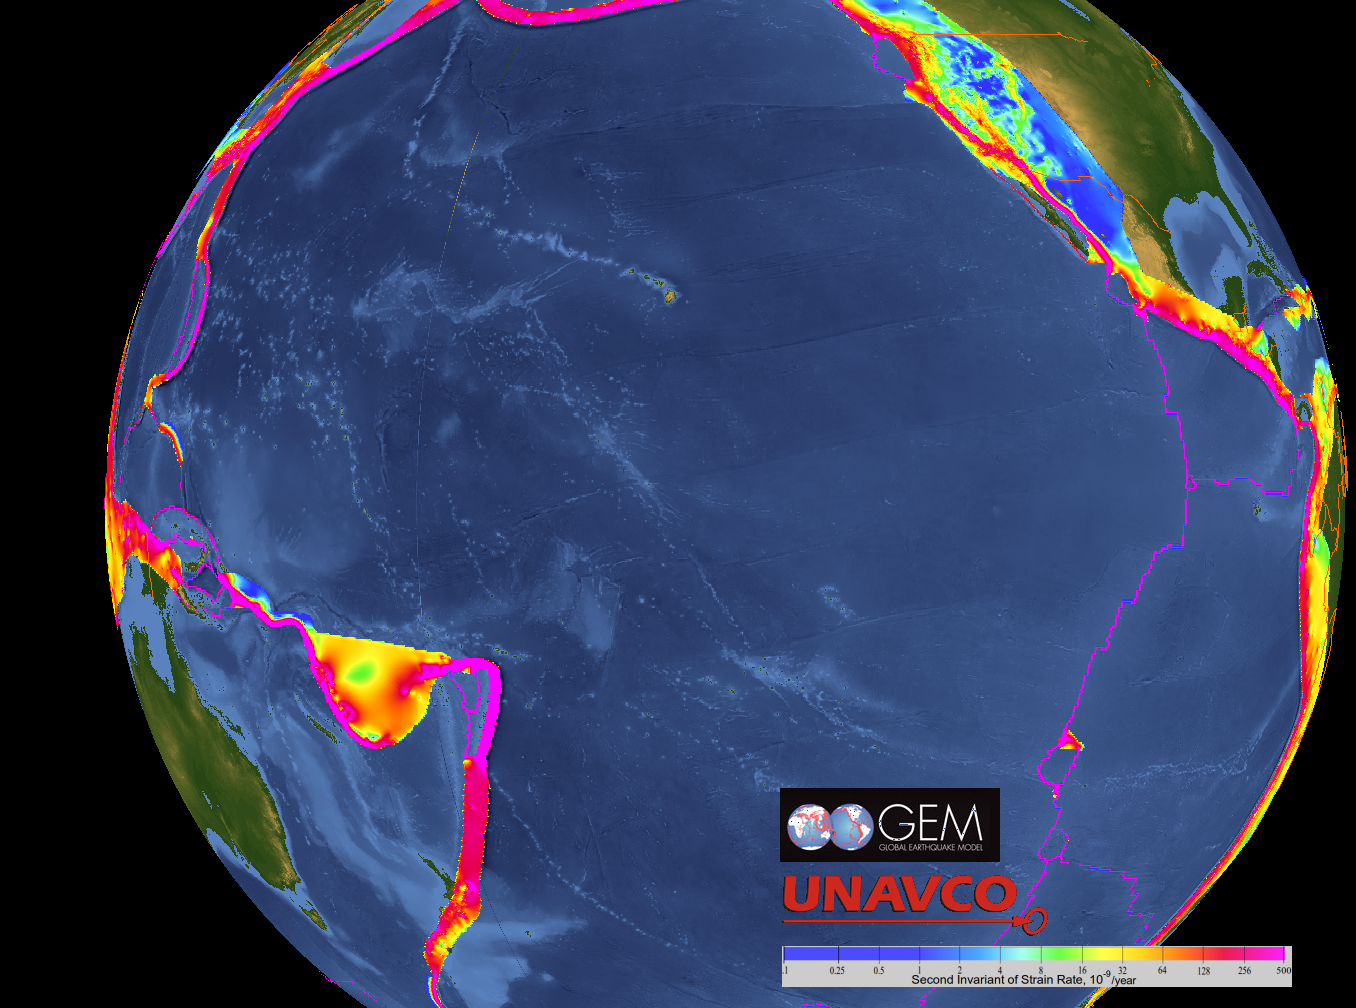
Click for the GEM GPS Velocities Viewer GEM GSRM Strain Rate MapsMaps of GSRM's strain rate magnitude (second invariant of the strain rate tensor), in units of nanostrain (10-9) per year. Grid is 0.1 degree by 0.1 degree resolution, approximately 11 km resolution. The topography is colored by elevation. Topography data is from Global Digital Elevation Models: Smith and Sandwell v11.1. Image legends show strain rate magnitude values by color, in units of nanostrain (10-9) per year. The imagery was made by UNAVCO. You can see individual grid cells represented by single color squares in the maps. The squares are about 11 km along the north-south sides.
Asia zoomed Europe Europe zoomed Western Hemisphere North America South America Pacific Pacific zoomed GEM GSRM Strain Rate Maps for the Geohazard Supersites
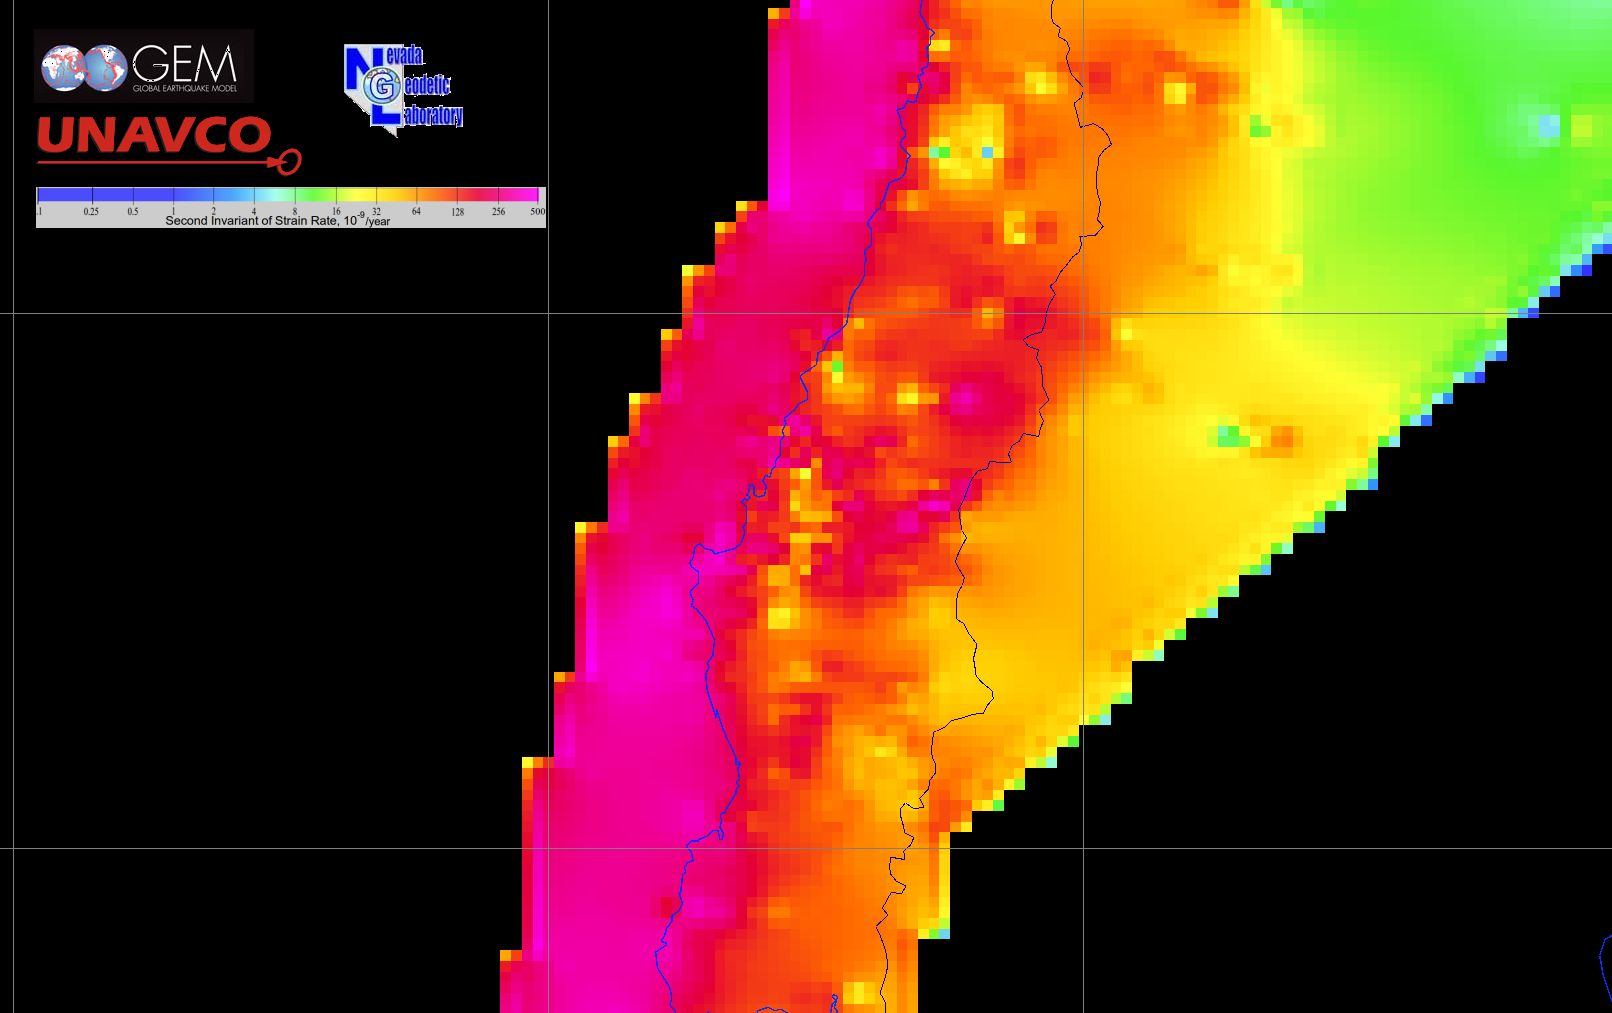
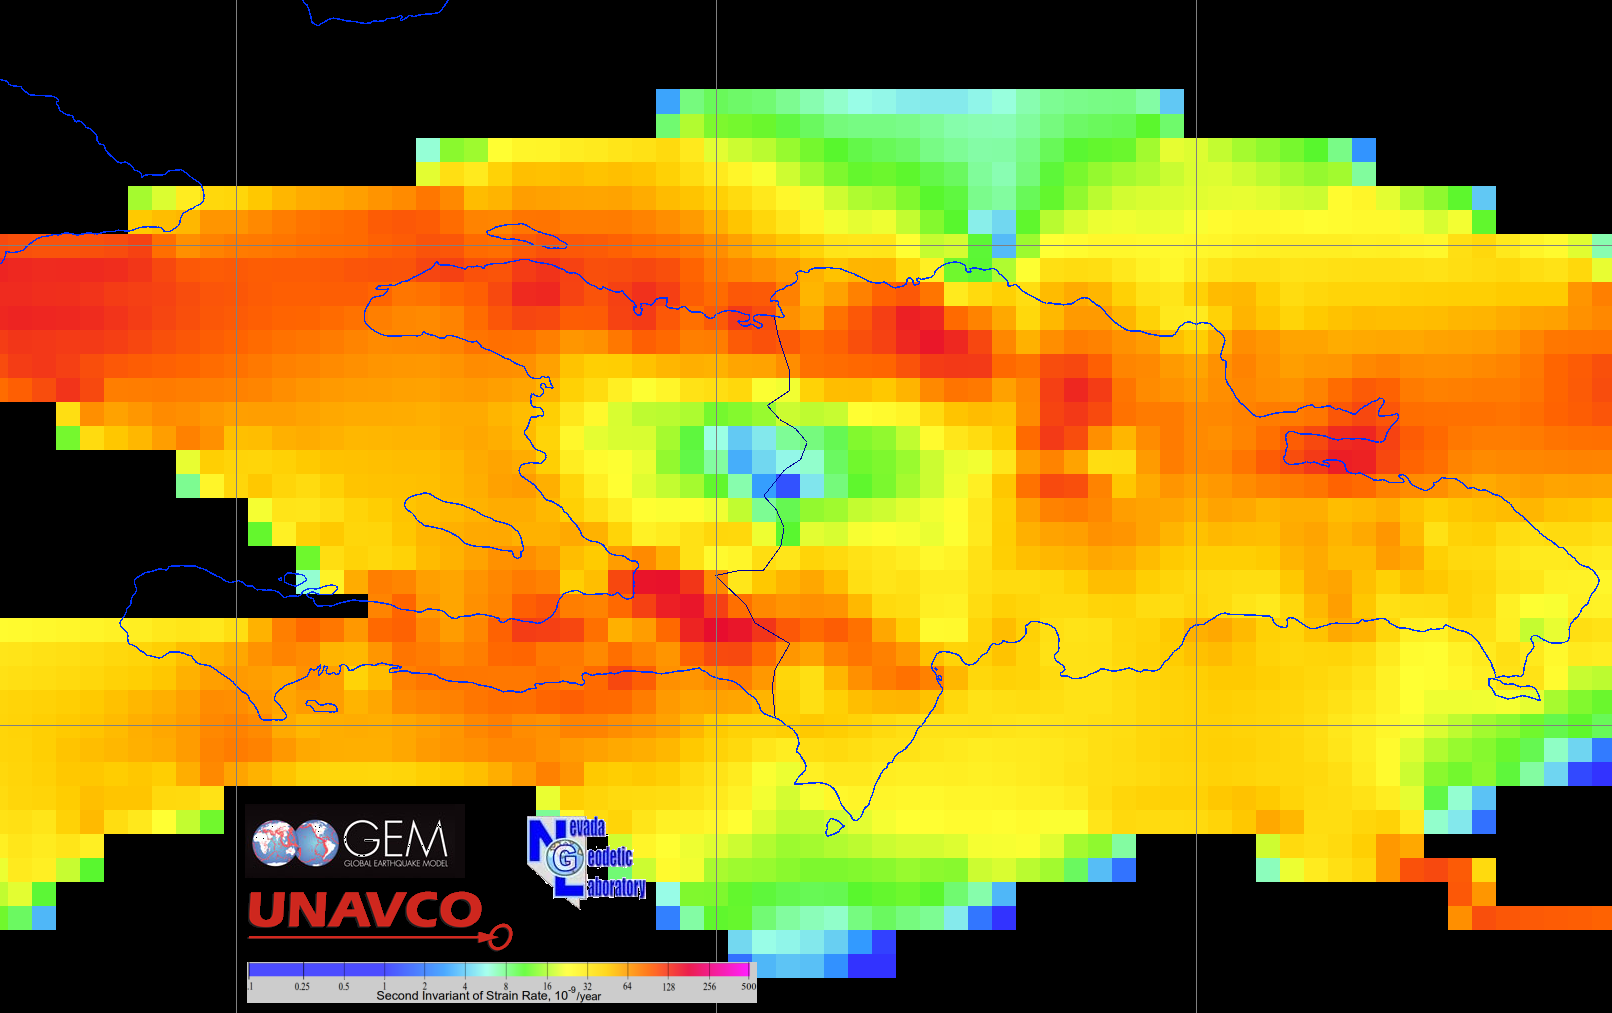
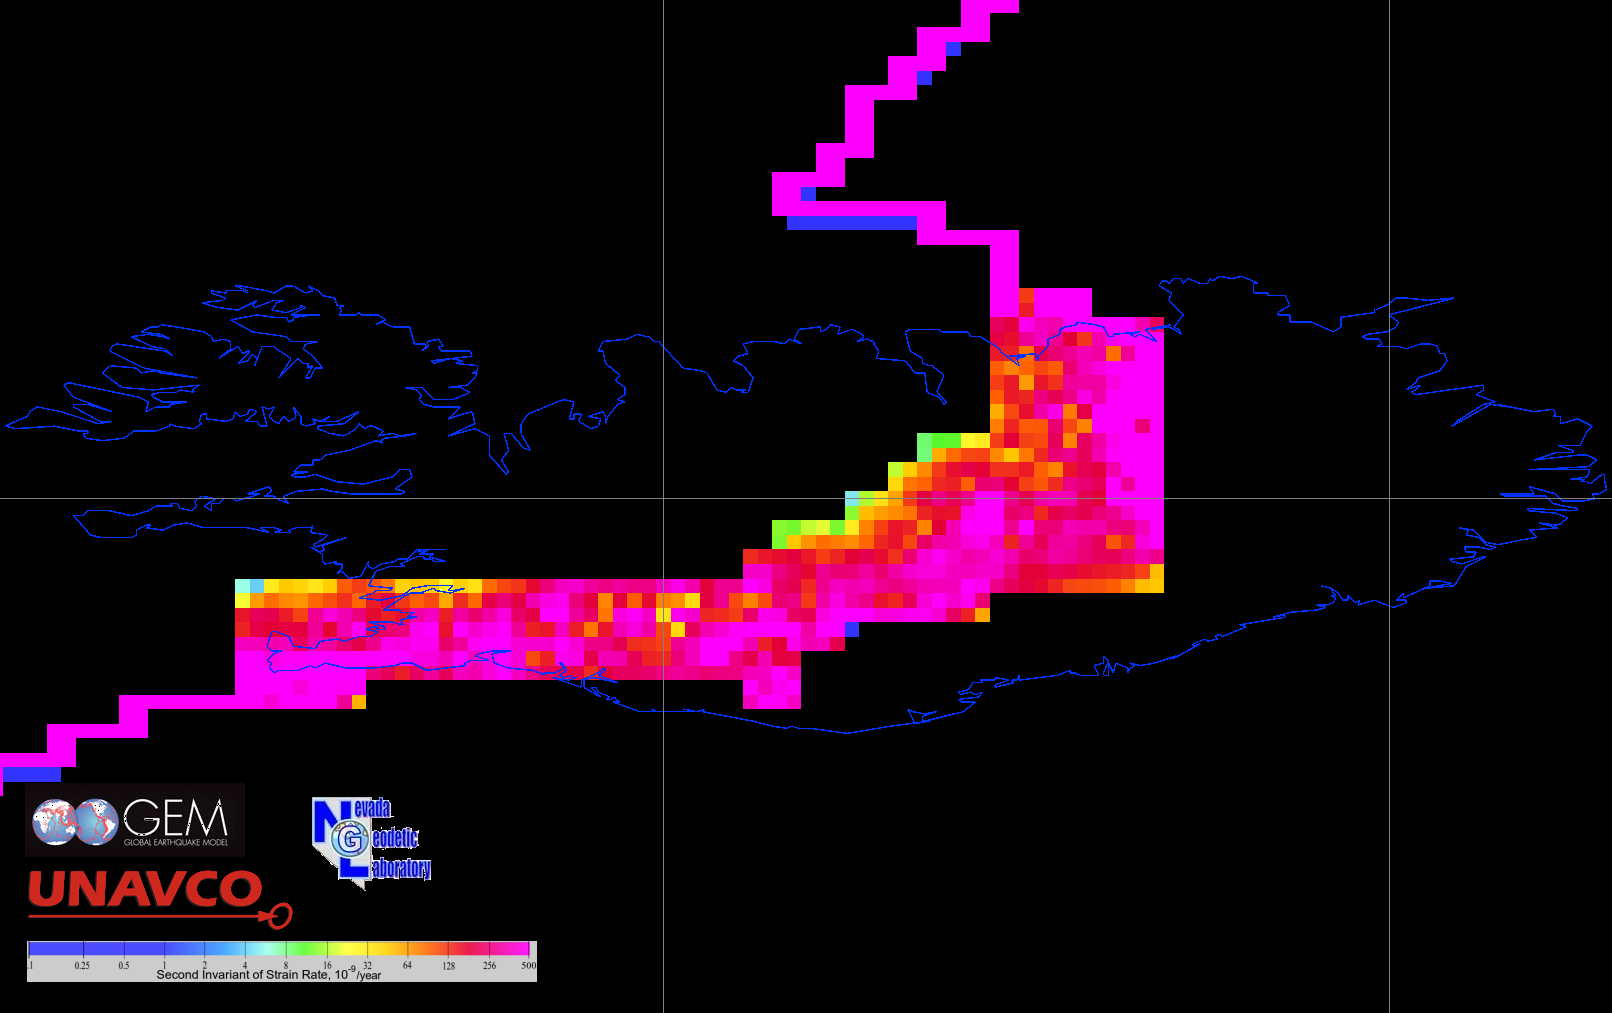
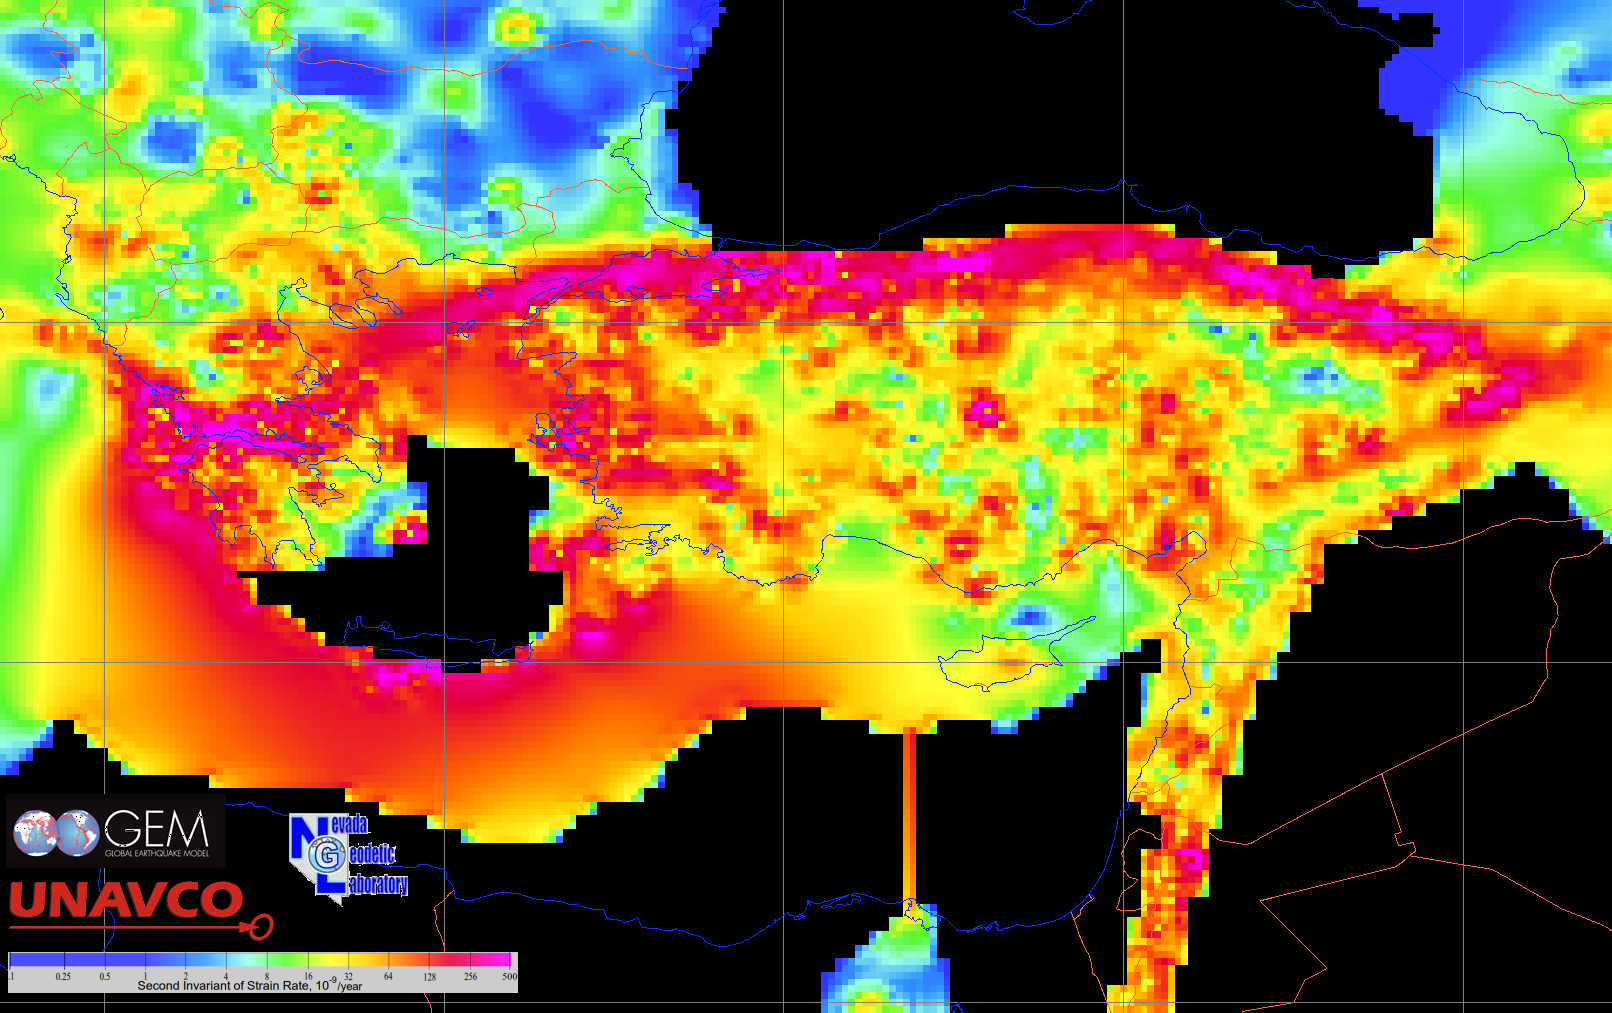
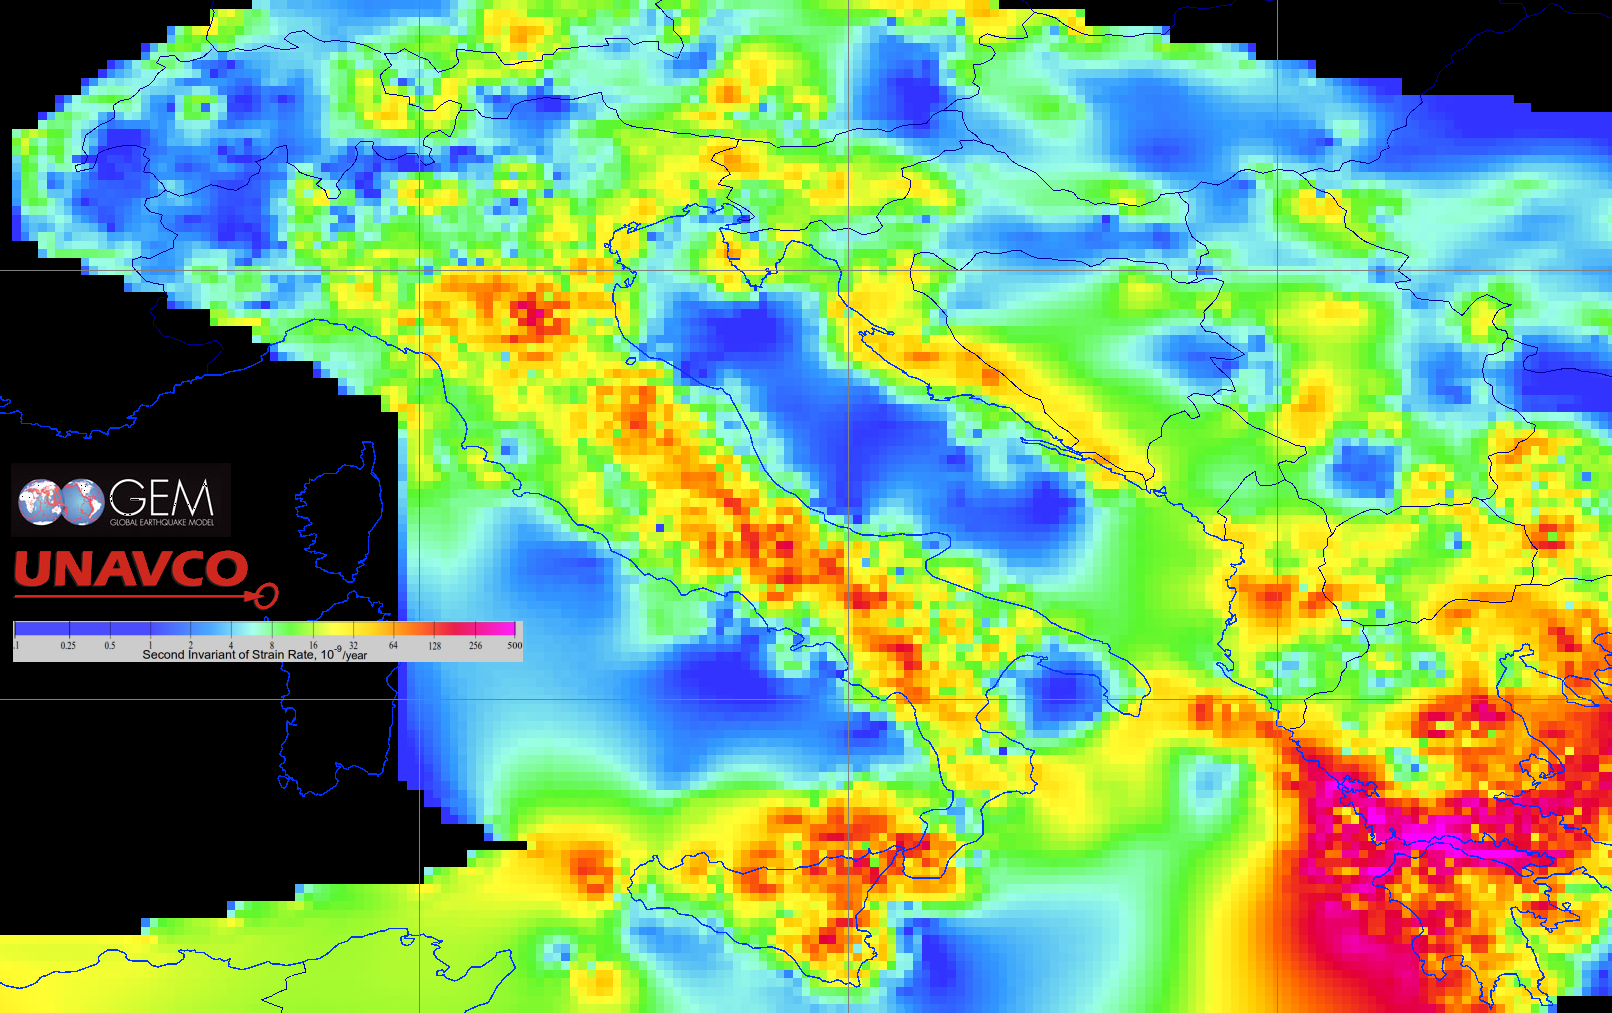
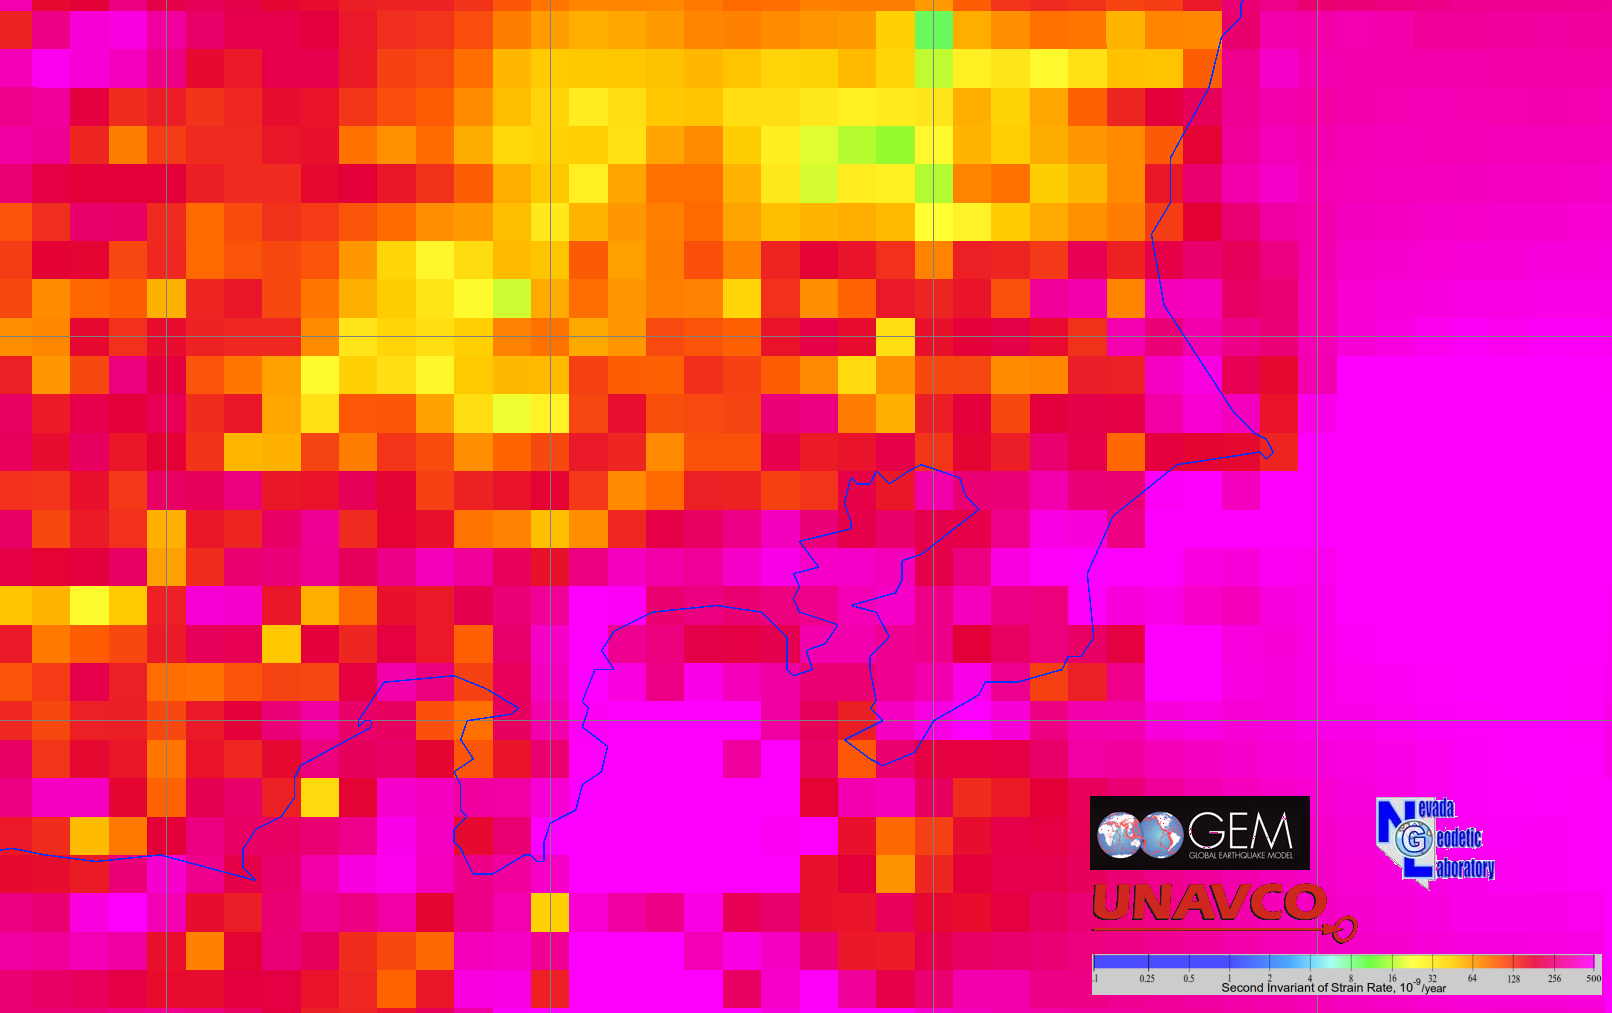
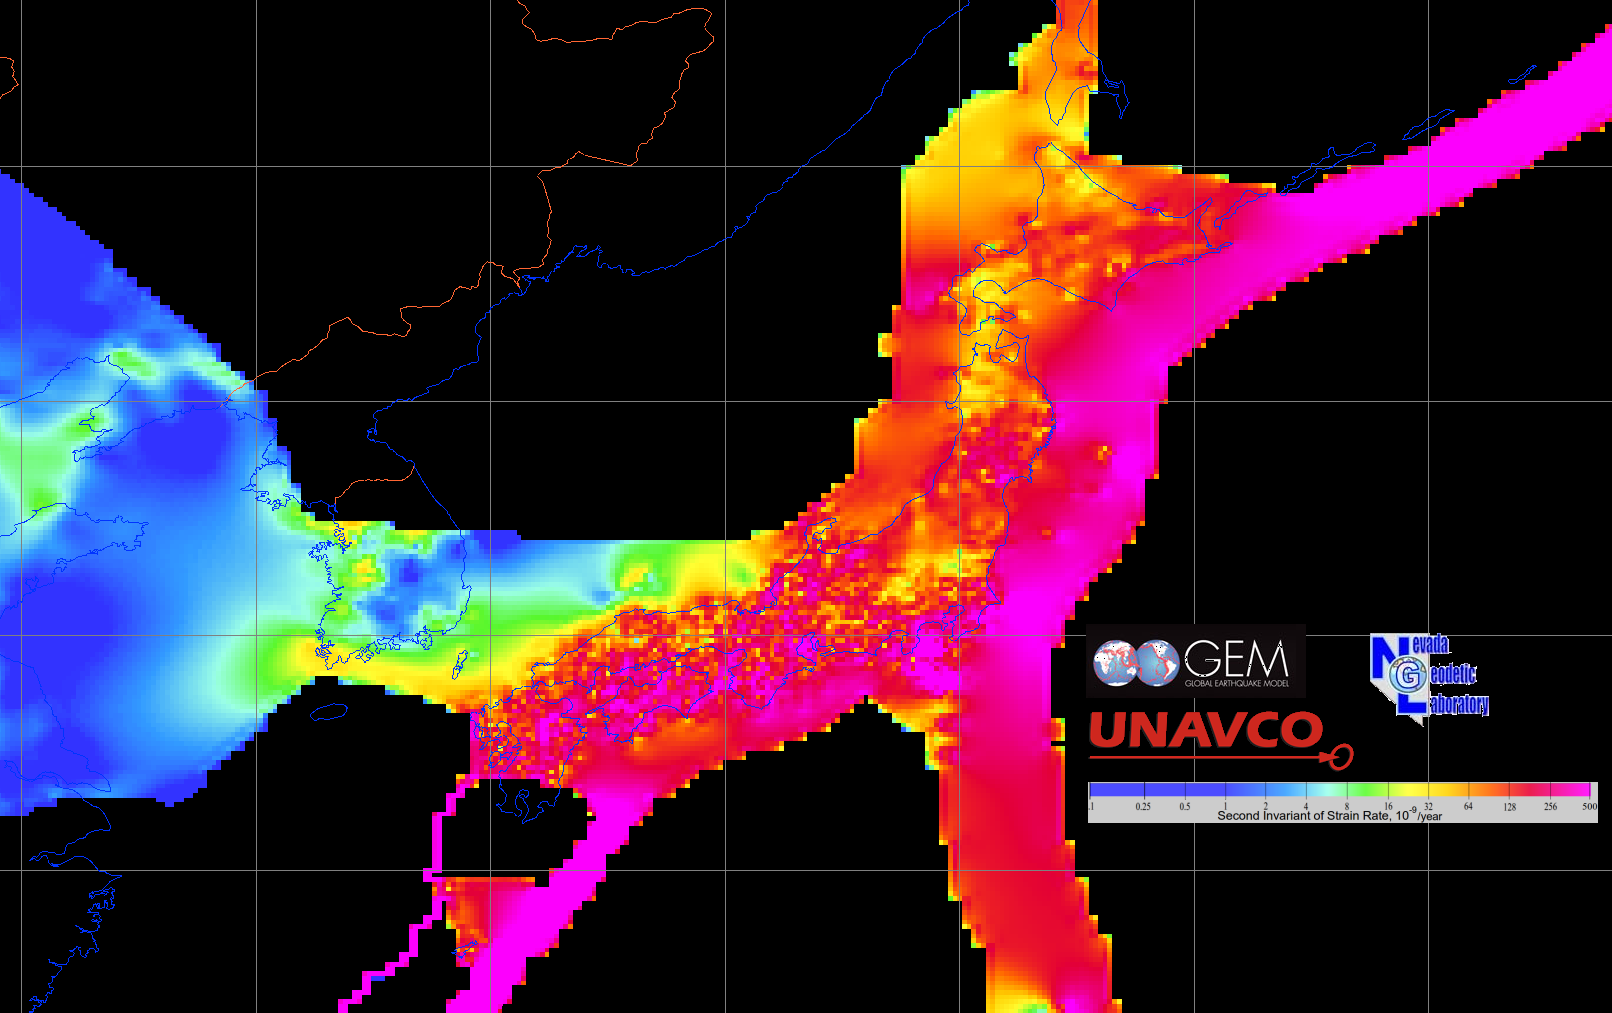
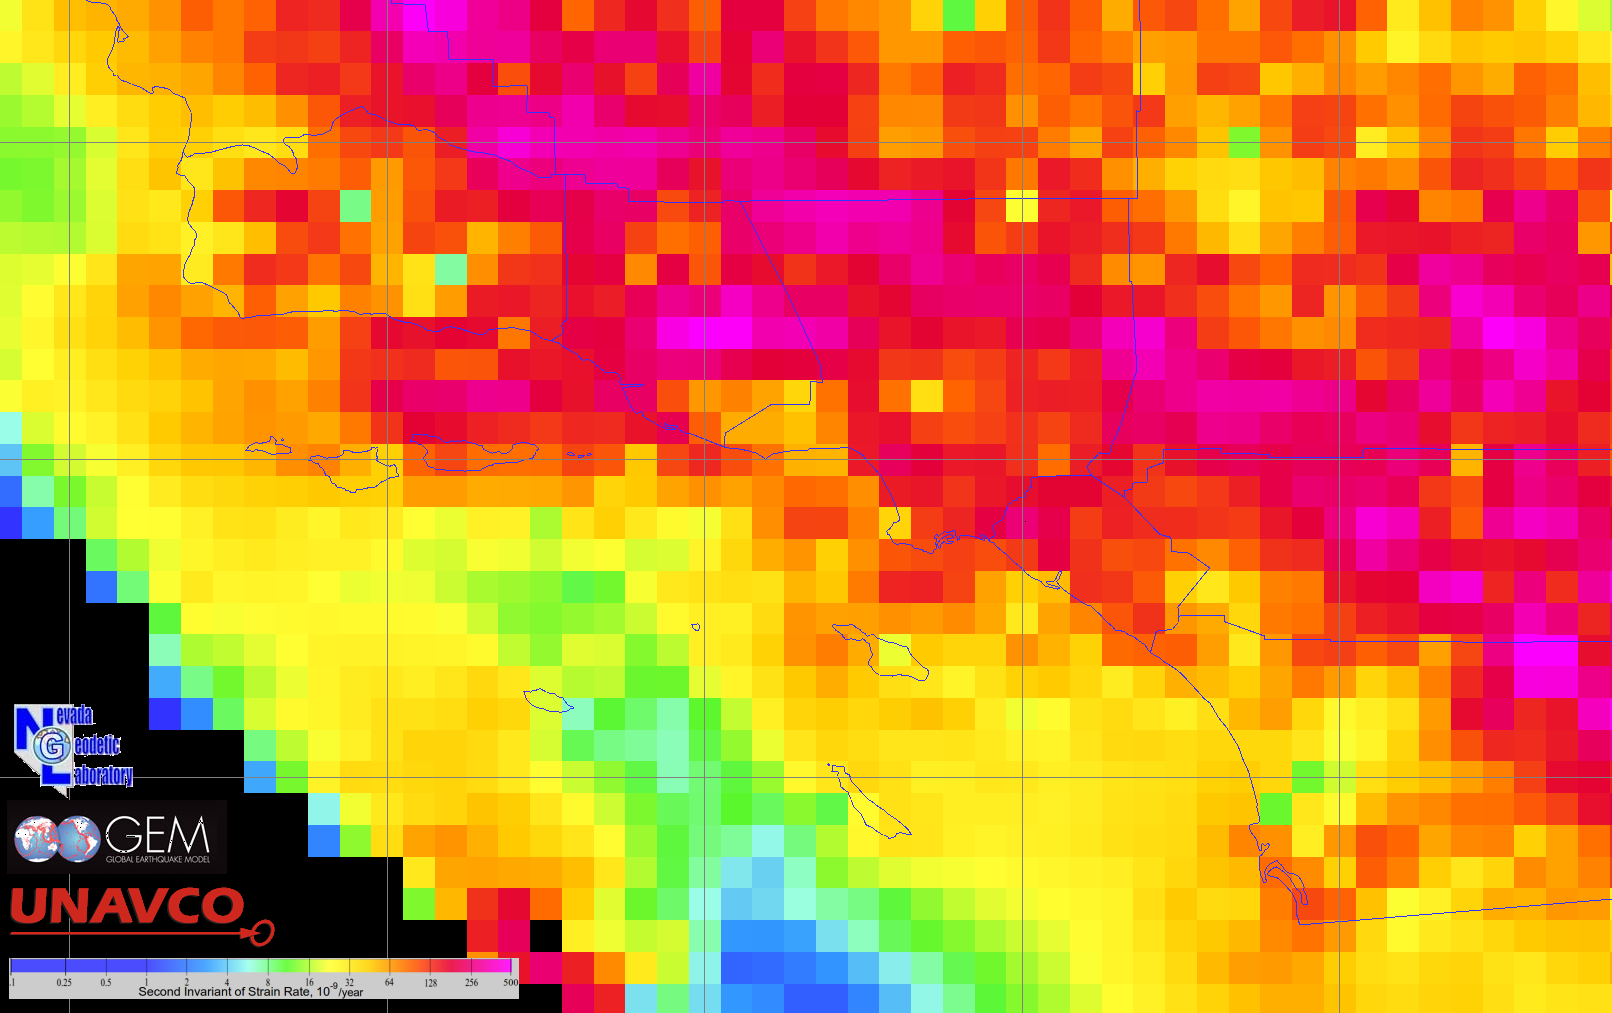
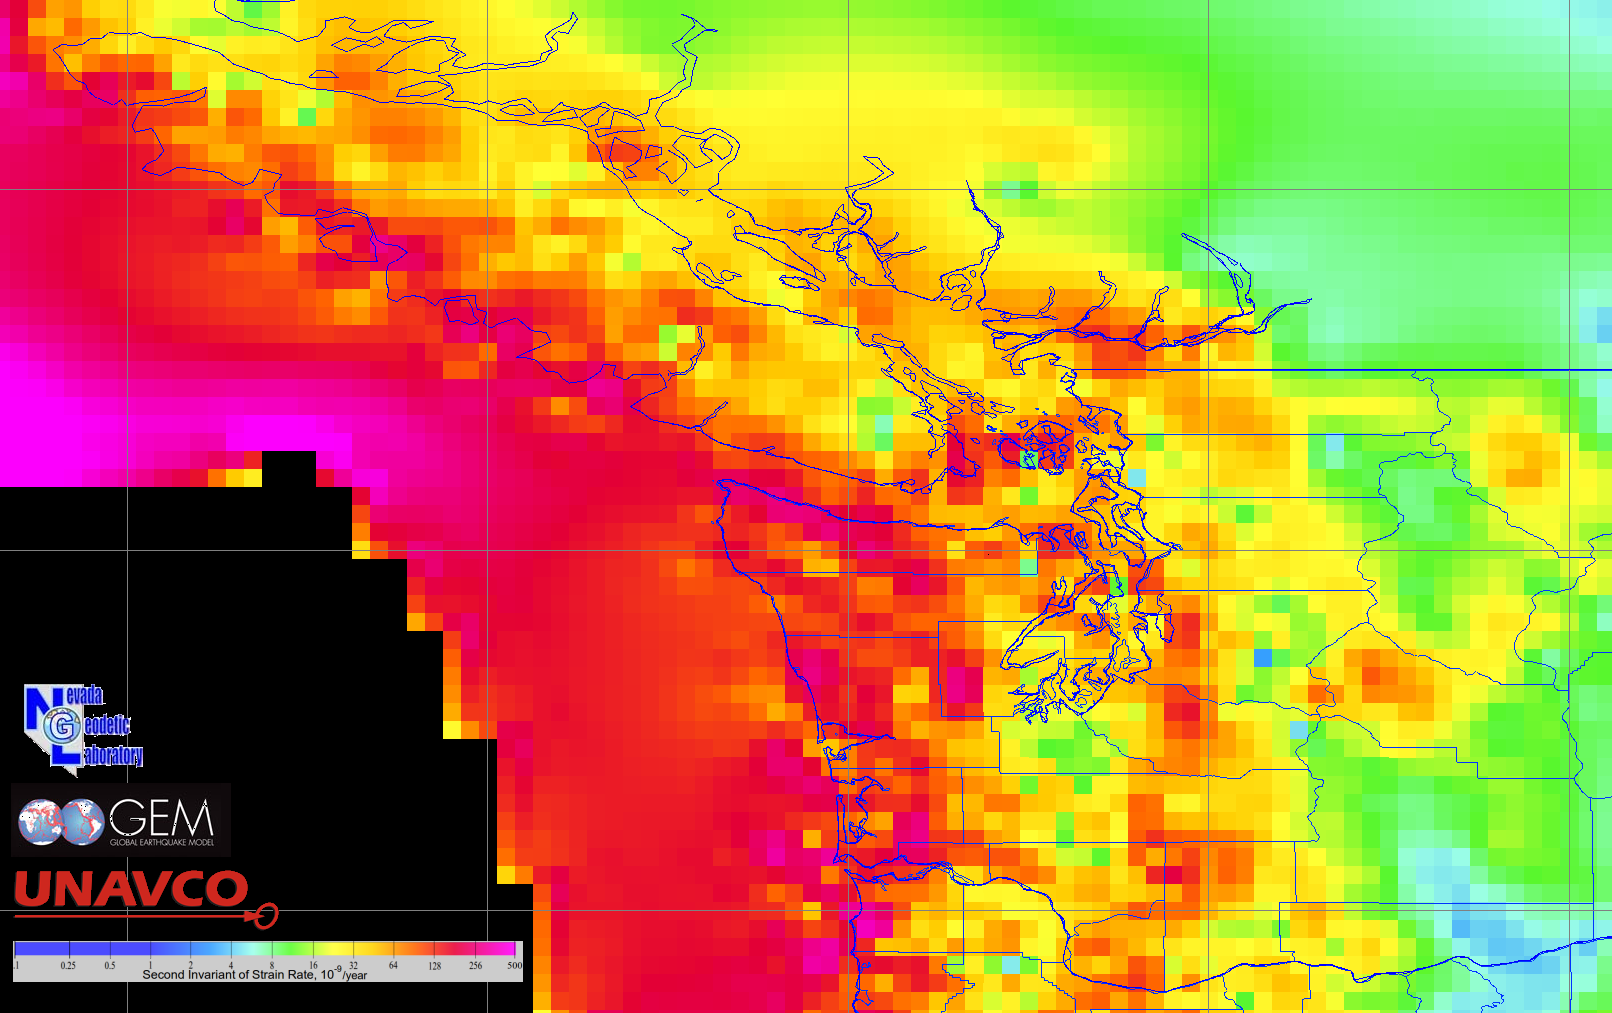
Here are map images of GSRM's strain rate magnitude (second invariant of the strain rate tensor). for some of the Geohazard Supersites. The GSRM model's grid, visible in the maps, is of resolution 0.1 degree by 0.1 degree. The imagery was made by UNAVCO. The maps' legends show strain rate magnitude values by color, in units of nanostrain (10-9) per year. You can see individual grid cells represented by single color squares in the maps. The squares are about 11 km along the north-south sides.
Haiti Iceland Greece and Turkey Istanbul Etna, Vesuvius, and Italy Tokjo Japan Los Angeles Seattle and Vancouver The maps' projections are 'square' latitude-longitude, to enable these images to be used in mapping tools such as Google Earth. The gray latitude and longitude lines are on exact integral values of latitude and longitude. To convert the black background to transparent, on Linux use Image Magic's "convert" command, such as: convert GEM_GSRM_Supersites_lat_lon_Chile.png -transparent black GSRM_Chile_transpar.png to make the true black pixels transparent in the new image file GSRM_Chile_transpar.png. |
|||||||
 |
Last Modified: 2019-12-27 15:15:50 America/Denver |
||||||